- 404
- Home
- Remote Administration
- Employee Monitoring
- Information Security
- Features
- Live Employee Desktop
- Employee Internet Monitoring
- E-mail monitoring
- Keystroke Monitoring
- File Activity Monitoring Software
- Printed document tracking
- Optical Character Recognition (OCR)
- Smart rules & alerts
- Network activity monitoring
- App usage/application monitoring
- Instant Message Monitoring
- Remote Desktop Control
- Active vs. Idle Time Analysis
- Employee Productivity Tracking
- Linux terminal capture
- Nonproductive Activity Reporting
- Custom reports
- Session Recording & Metadata
- User Card
- Screen Capture
- Web-cam snapshots
- USB device control
- Data Leak Prevention (DLP)
- Voice communication recording
- File Scanner
- Software and Hardware Inventory
- Insider Threat Detection & Prevention
- Remote Employee Monitoring
- Privileged User Monitoring
- Productivity optimization
- Third Party Vendor Management
- Compliance Management, Auditing & Monitoring
- Cases
- GDPR Compliance
- For HIPAA
- For Legal
- Government & Public Sector Cyber Security
- PCI DSS Compliance & Certification
- General Data Protection Regulation (GDPR)
- Energy & Utilities Sector Cyber Security
- For Financial Sector
- Retail & Ecommerce Cyber Security
- About Us
- Why Us?
- Partners
- White Papers
- Support
- Pricing
- Request demo
- Solutions
- Purchase
- Demo request
- 404
- index
- Remote Administration
- Employee Monitoring
- Information Security
- Features
- Insider Threat Detection & Prevention
- Remote Employee Monitoring
- Privileged User Monitoring
- Productivity optimization
- Third Party Vendor Management
- Compliance Management, Auditing & Monitoring
- Cases
- GDPR Compliance
- For HIPAA
- For Legal
- Government & Public Sector Cyber Security
- PCI DSS Compliance & Certification
- General Data Protection Regulation (GDPR)
- Energy & Utilities Sector Cyber Security
- For Financial Sector
- Retail & Ecommerce Cyber Security
- About Us
- Why Us?
- Partners
- White Papers
- Support
- Pricing
- Request demo
- Solutions
- Purchase
- Demo request
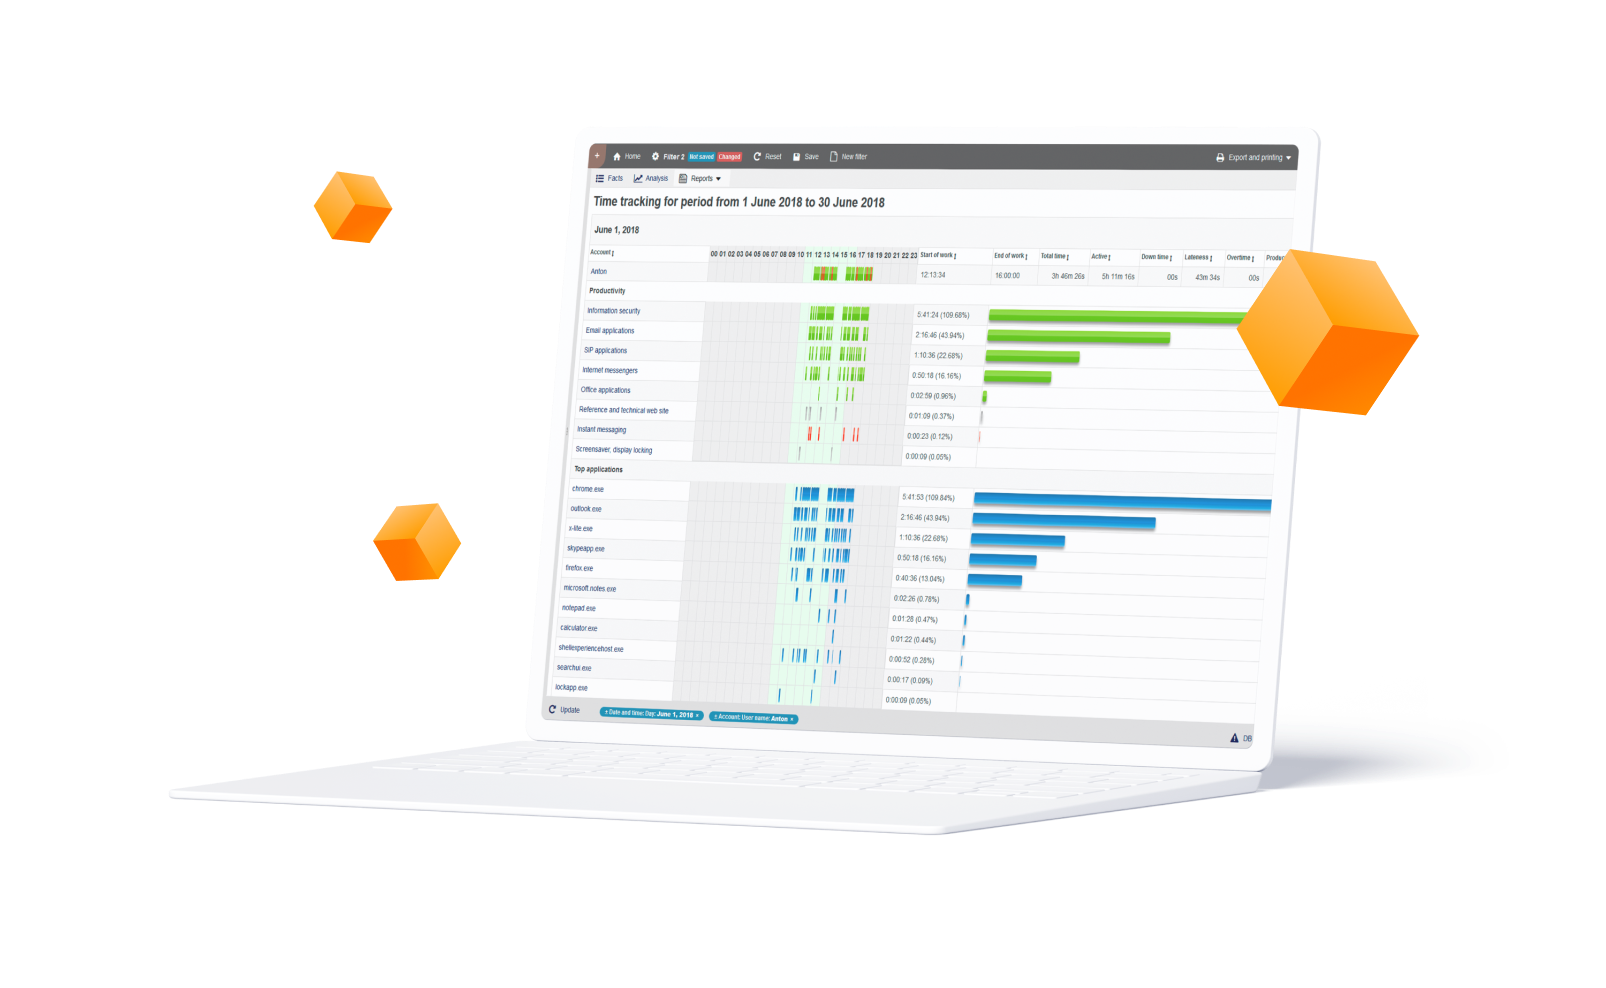
Configurable Monitoring Profiles
The ability to create fully-cutomized reports is the unique feature of StaffCop that is possible due to the usage of OLAP-cube data model. This technology allows to apply any amount of filtration criteria to collected data (including anti-fitlers). For each report a number of data visualization modes is available. Then, a number of reports can be united into a dashboard.
Event types
Filtration by event types is the fastest way to get a report related to a certain function (screenshots, web-sites visiting, file operation, etc). Each data type represents a corresponding module that is enabled in the configuration.
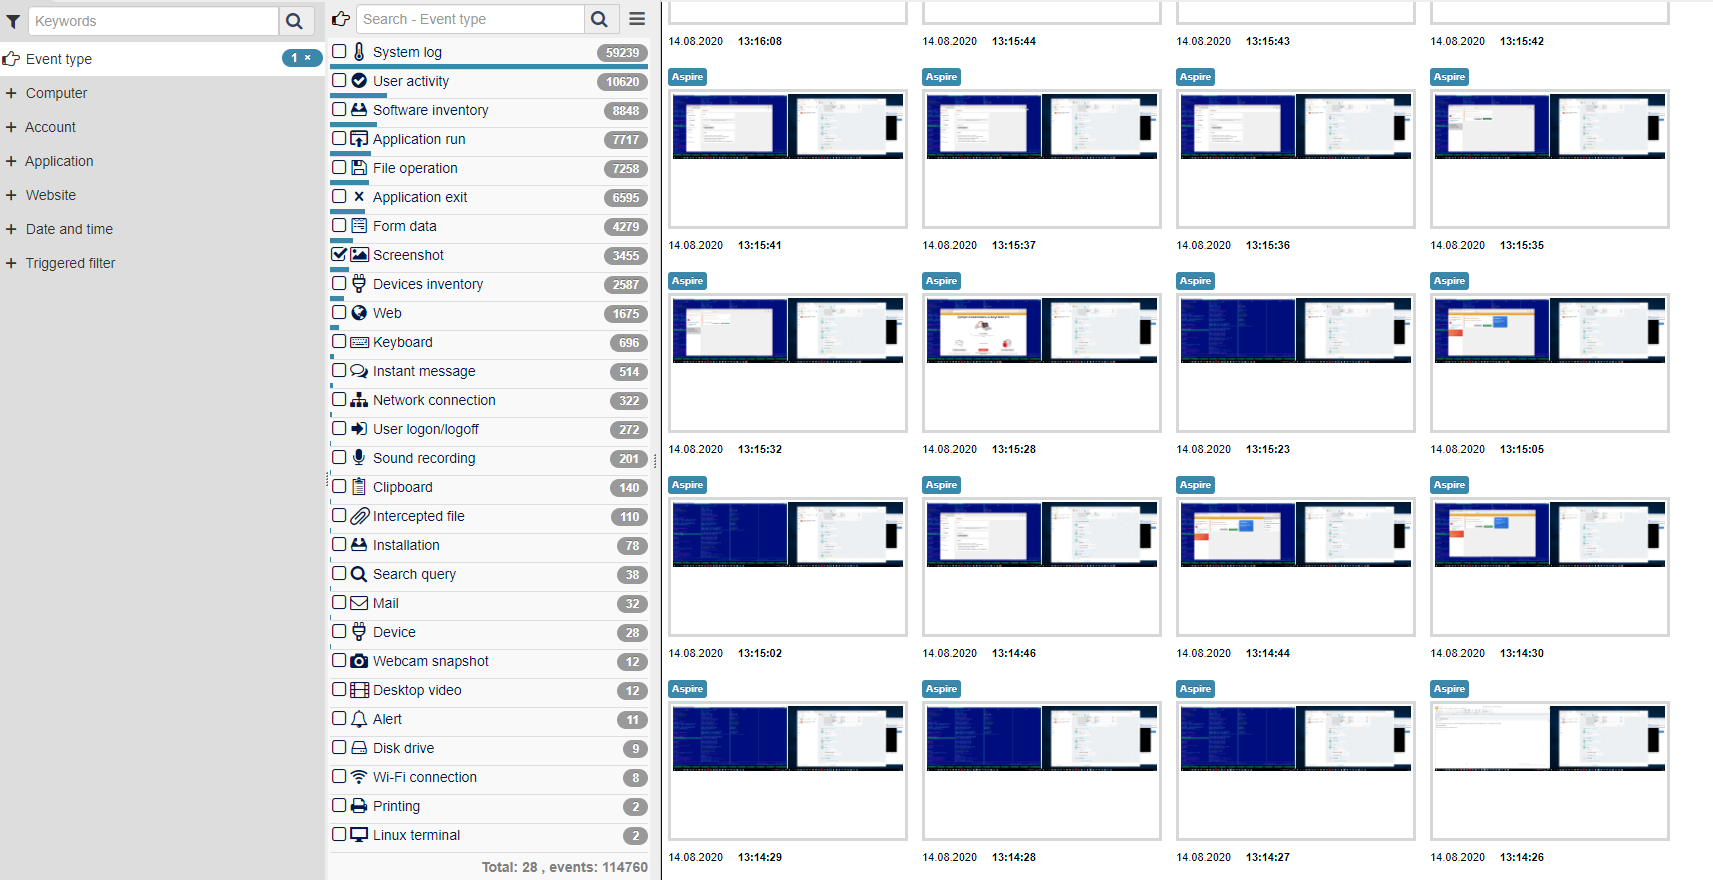
Filtering dimensions
Filtering dimensions can be applied together with Event types or separately. Each event recorded by StaffCop contains details related to its type. For example, "Web" events can be filtered by domain, subdomain, URL, application used for web-browsing. File operations contain details on file operation type, file path, information about the disk drive where this file is located, name of the application used for working with this file. Some details are common for all event types: time of event, computer and user account who initiated the event.
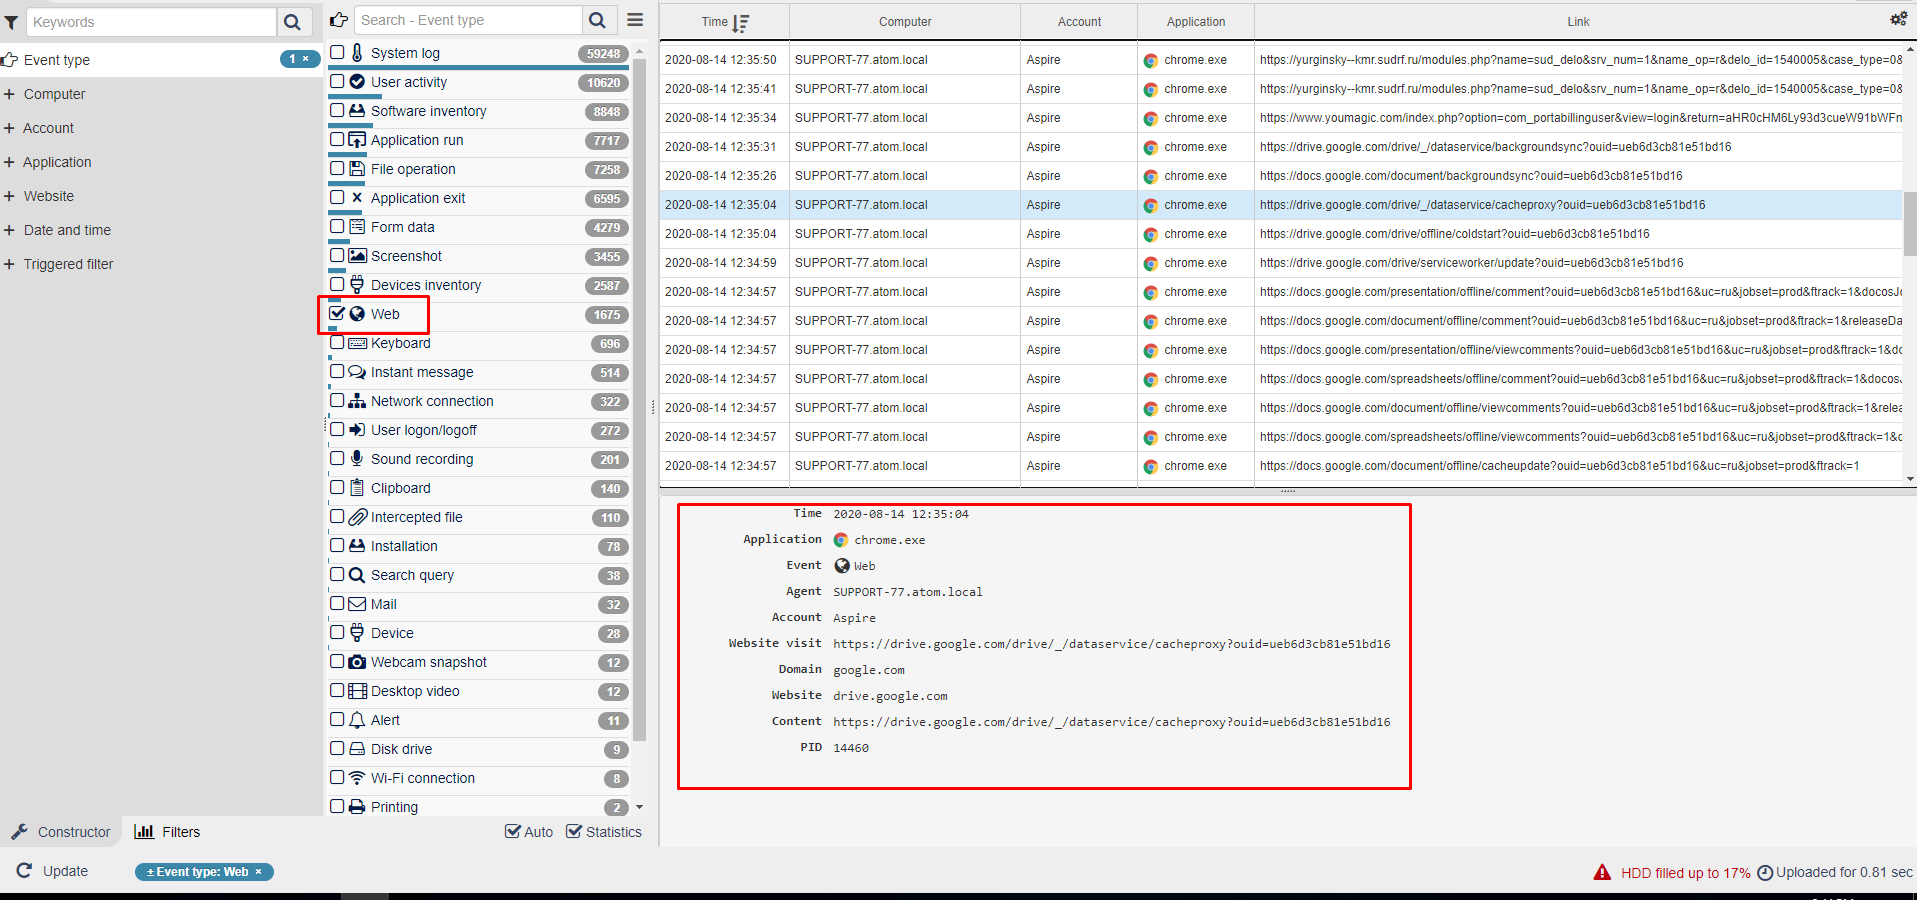
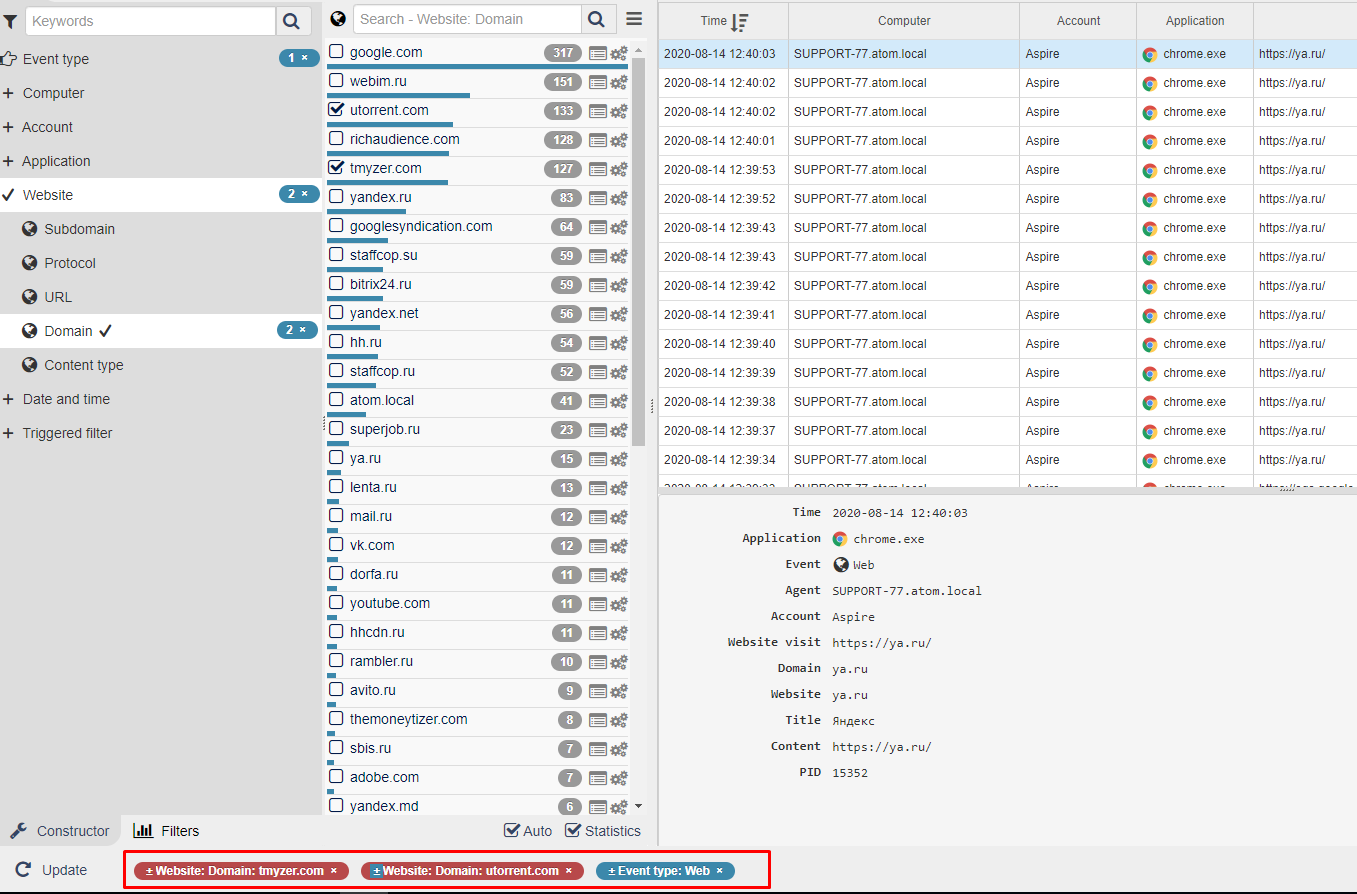
To apply filtration according to a particular parameter, the left panel of dimensions is used. When we chose "Web" event type we got the list of all web-site visiting events. We can further narrow the output by applying any filtration criterion available for this event type. For example, we are interested in visiting particular web-sites. Usage of dimension panel will give us the list of all website domains that were visited. In this example we choose "tmyzer.com" and "utorrent.com" and the output contains only events related to these two domains.
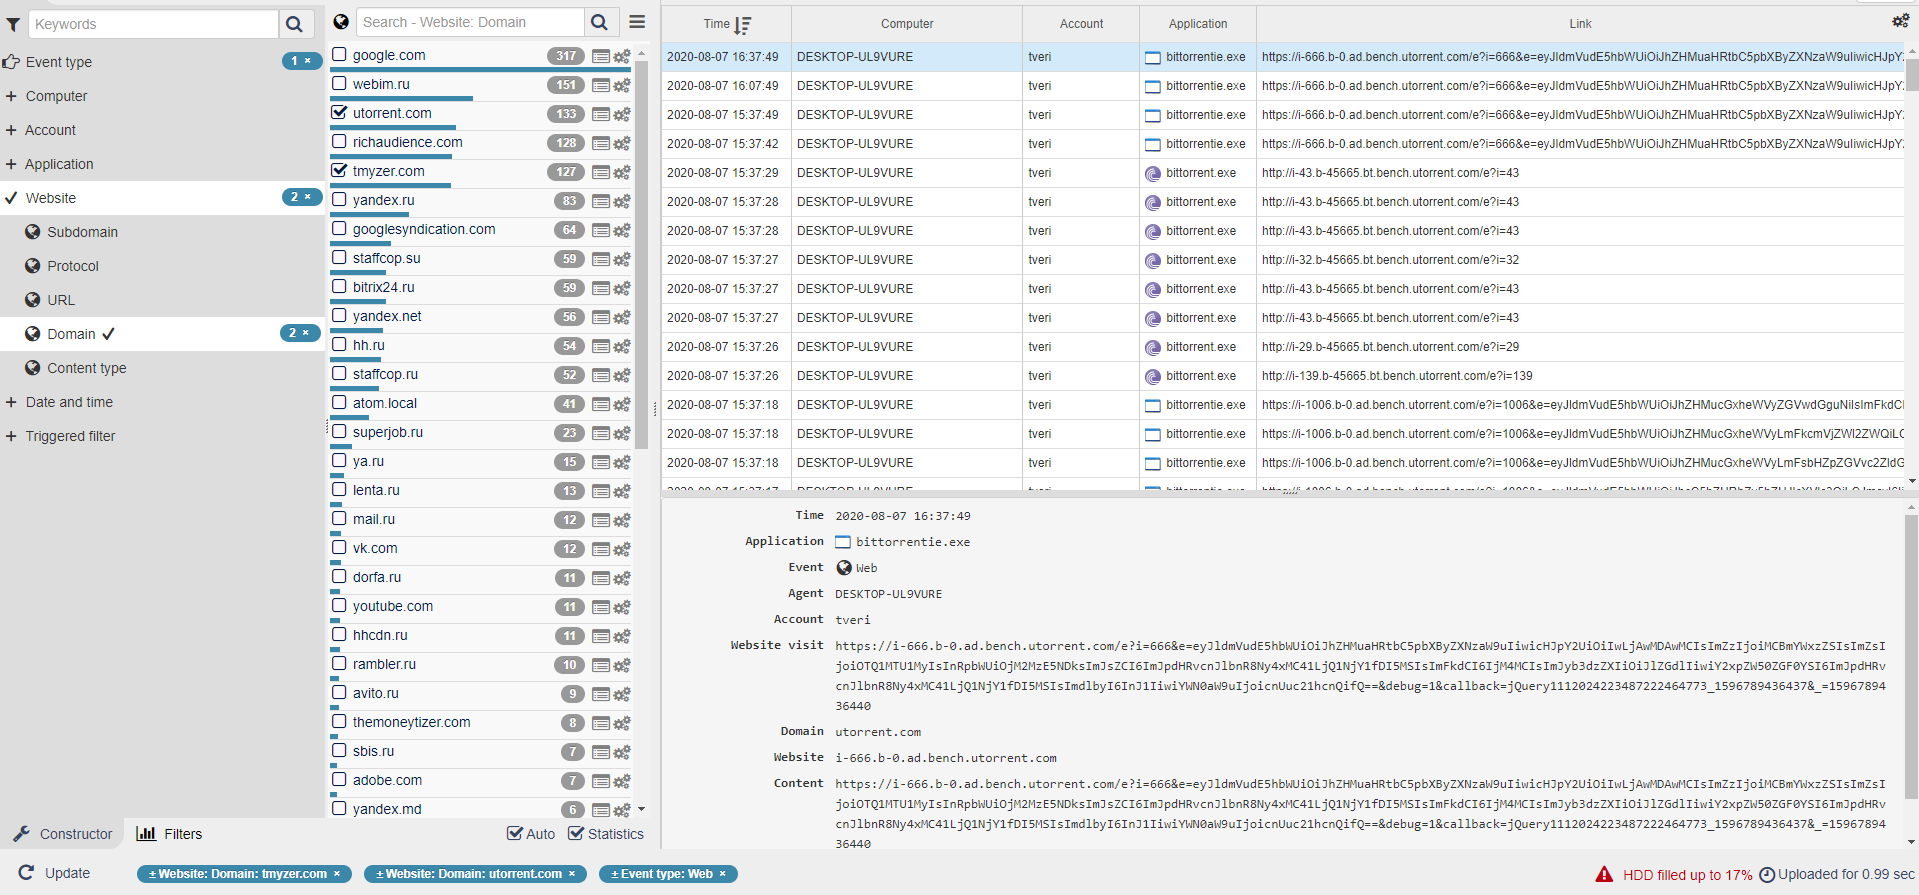
It's possible to apply anti-filters by reverting the currently applied ones. If we revert "tmyzer.com" and "utorrent.com" fitlers, the output will contain web-site visiting evetnts related to all registered domains EXCEPT "tmyzer.com" and "utorrent.com". In the bottom panel you can see all currently applied filters (blue for filters, red for anti-filters).
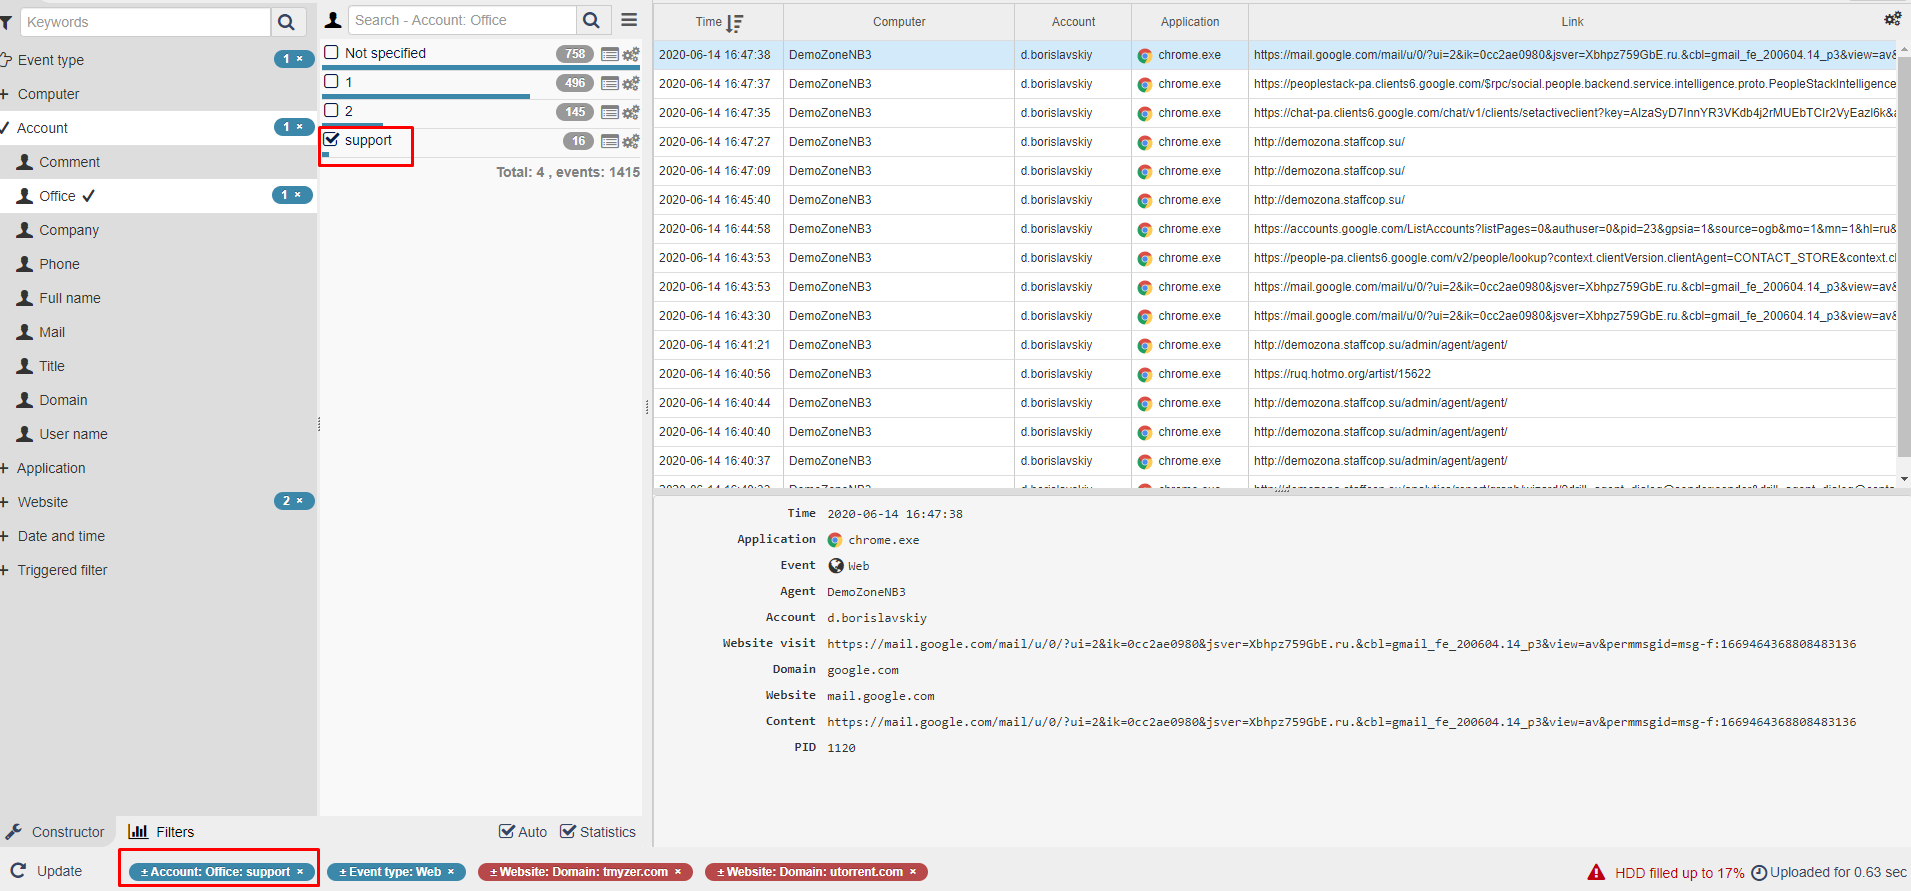
We can apply filters from other dimensions available for this event type. In this example we applied filtering by offices (or departments) so only activities performed by users of "support" department are displayed.
Complex logic
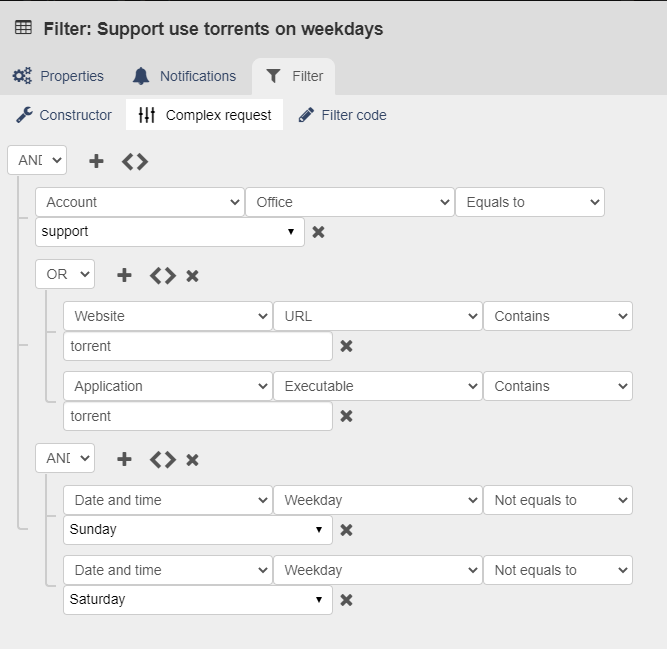
The easiest way to create filters is to use Constructor and the currently collected data - in this case you can just "Save" the applied filtration criteria as a filter. But quite often, it's required to create a filter for things that haven't yet happend, or to create a filter with the usage of substring (part of word) or to create a filter triggered by a complex chain of conditions. In this case, we can use "Complex request" option for creating filters. The example below contains a filter which will show when members of "Support" department use torrents during their working days (suppose that they work MO-FR). For this we set a filter with 3 conditions:
1. "Office" parameter equals to "Support"
2. Web-site URL contains "torrent" OR applications name contains "torrent"
3. Weekdays are not equal to Saturday AND not equal to Sunday
1. "Office" parameter equals to "Support"
2. Web-site URL contains "torrent" OR applications name contains "torrent"
3. Weekdays are not equal to Saturday AND not equal to Sunday
Data visualization
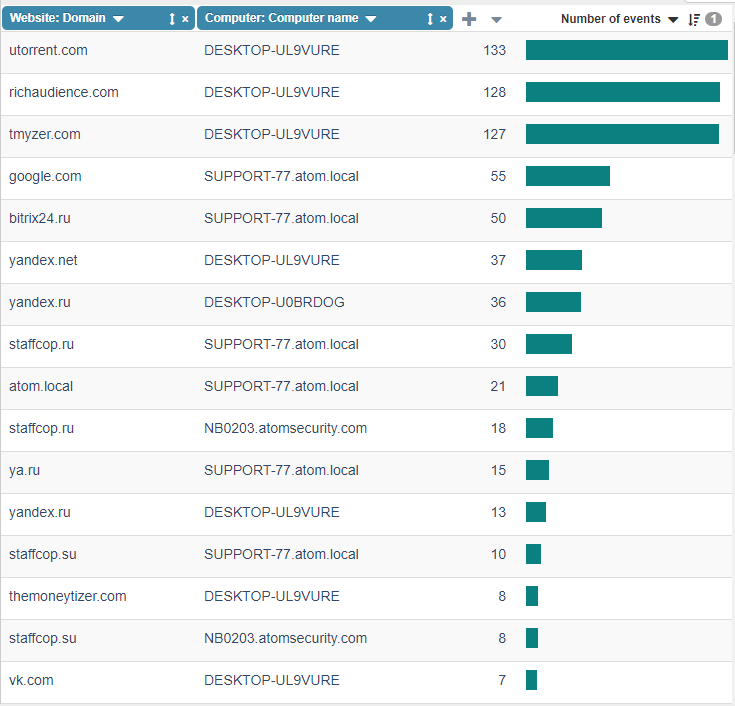
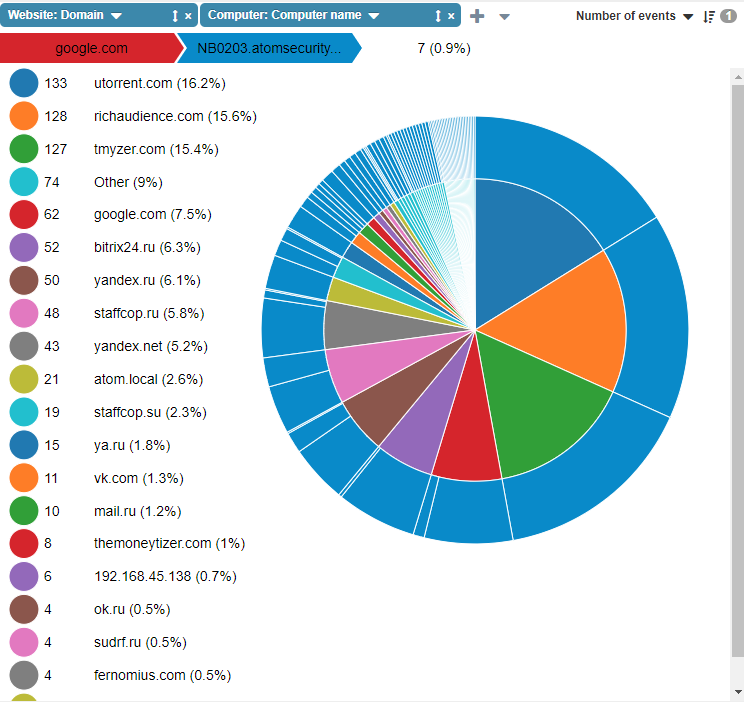
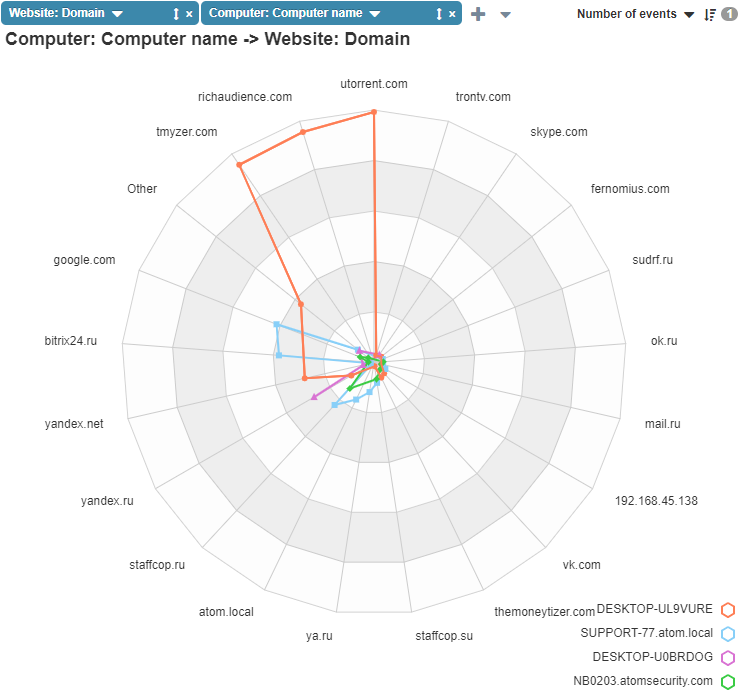
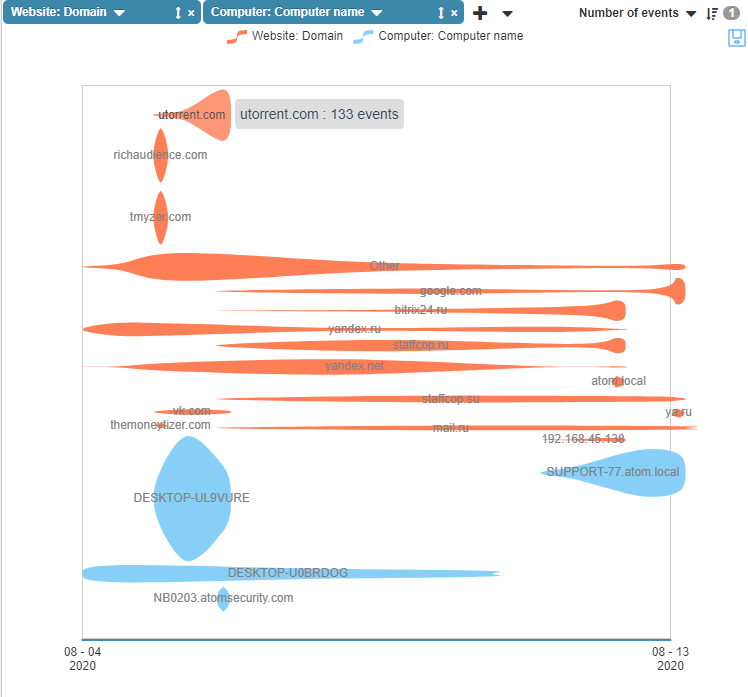
StaffCop features 12 customized data view modes that can be applied to any report that you created by following the previous steps. They are found in menus "Facts" and "Analysis" and they include tables and various types of graphs and charts. View modes from "Facts" menu represent output of the events already set by the currently applied filters. View modes from "Analytics" menu allow changing (add new or remove existing) currently applied number of fitlers in order to get the desired output.
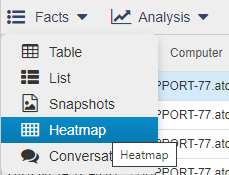
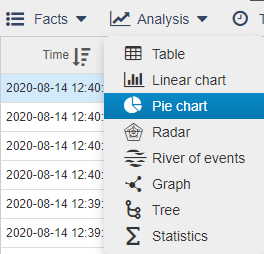
StaffCop features 12 customized data view modes that can be applied to any report that you created by following the previous steps. They are found in menus "Facts" and "Analysis" and they include tables and various types of graphs and charts. View modes from "Facts" menu represent output of the events already set by the currently applied filters. View modes from "Analytics" menu allow changing (add new or remove existing) currently applied number of fitlers in order to get the desired output.
E-mail reports
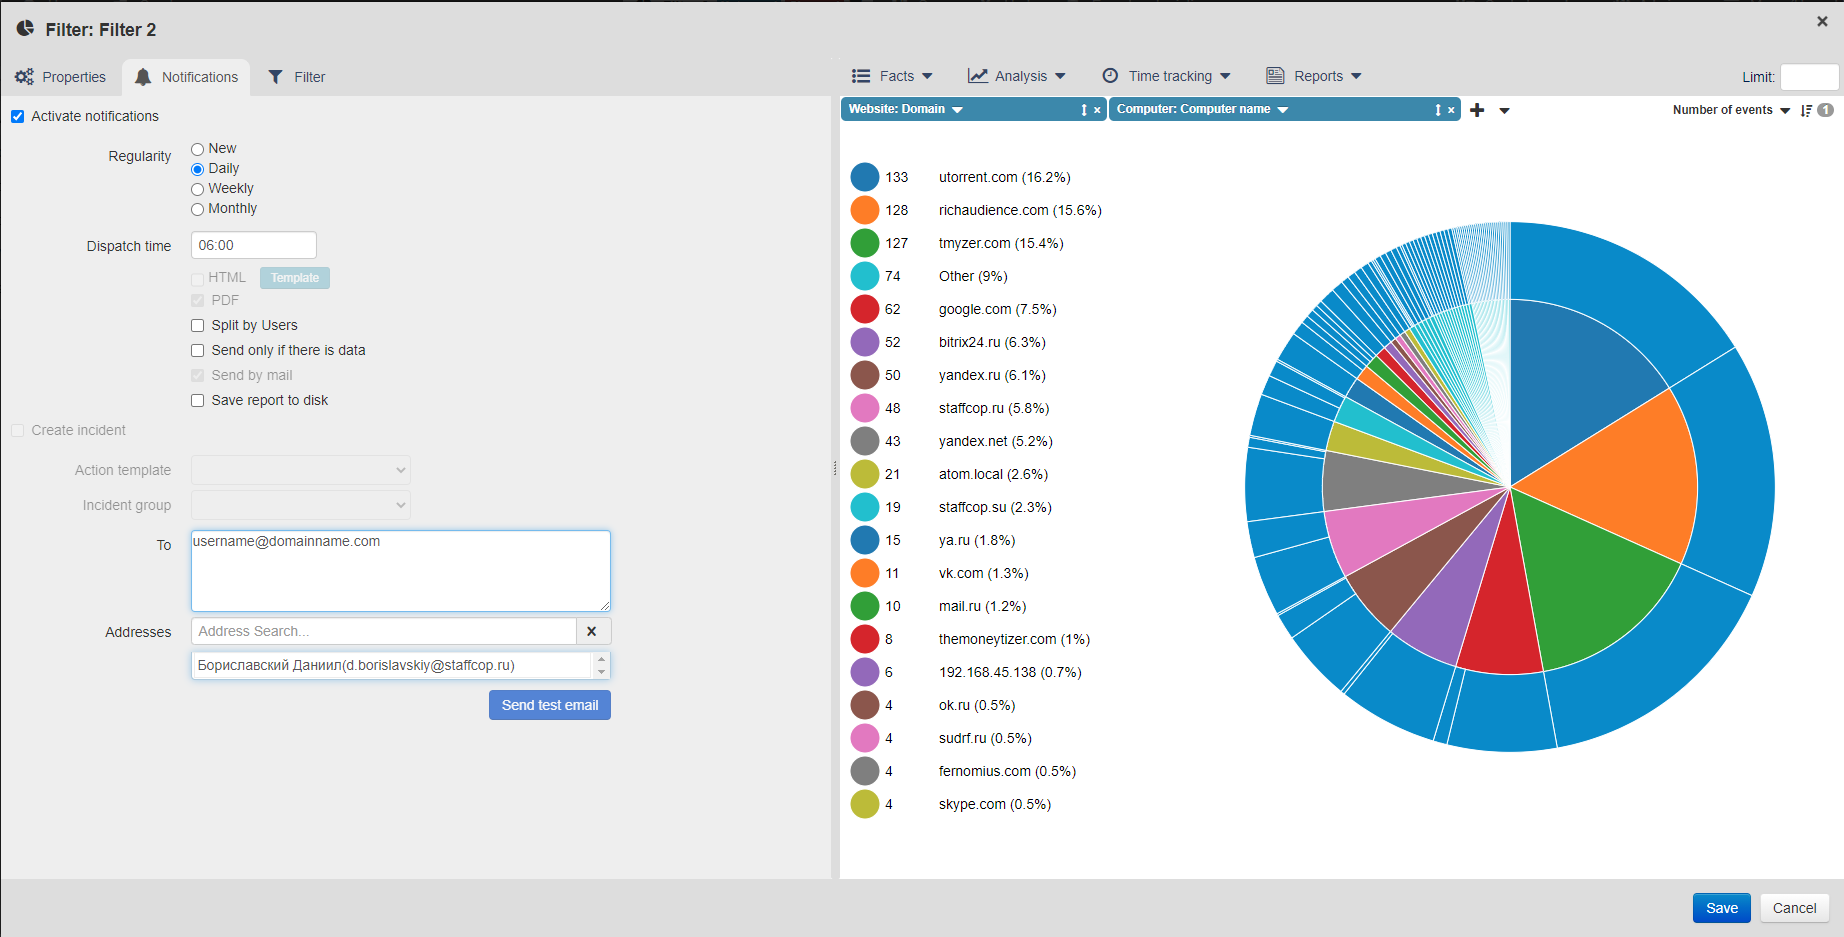
When you have specified filtration criteria and chosen the most approapriate data view mode, you can set-up e-mail scheduled reports. For some parts of complex reports PDF-format of e-mail reports can be unavailable.
Dashboards
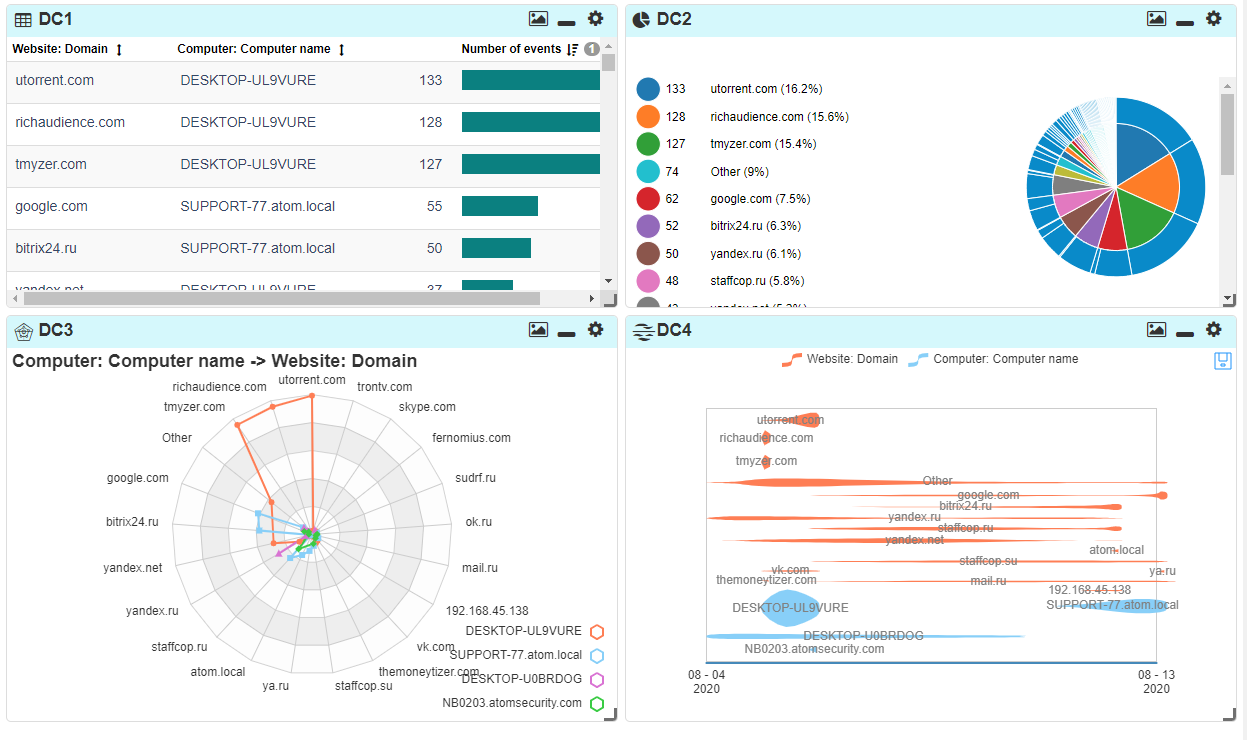
Dashboards represent a number of filters combined together for a handier representation of information related to a particular object or task. On the screenshot below there is a dashboard containg the data view modes used in the previous example placed on a single page.
Start free trial

LEARN
Documentation SUPPORT
%201.svg?v=2020-10-15T10:37:02.579Z)
